
SINOMO - Software Guide
(February 9, 2011)
Abstract:
Contents
- Introduction
- File Information
- System Requirements
- Using SINOMO
- File Formats
- Example Networks
- Program Customisation
- High-Throughput Analyses
- Final Remarks
- Details on <input>_analysis.mat
- Bibliography
Introduction
Interactions and connections--be it in sociology or engineering--are often represented as networks, whose studies have improved understanding of underlying features and mechanisms. In many cases, irregularities in structure were identified as vulnerability or as crucial for best case performance. Advanced techniques to detect and specify unusual network-components are thus being developed. One way to characterise complex networks is by their specific connectivity patterns, called network-motifs (Milo et al., 2002), which can be identified using mfinder.1Here we use a different approach, which is to describe networks by node-motifs--a combination of local network features. Certain node-motifs, such as highly connected nodes or hubs, have been shown to be important components of networks (e.g. see (Jeong et al., 2001; Albert et al., 2000; Rodrigues and Costa, 2009)). Costa et al. (2009) have presented a technique to detect and specify more complex compound motifs, which are characterised by multiple features in combination. We described improvements to that method and showed how its parameters can be determined automatically (Echtermeyer et al., 2011). This document describes our implementation SINOMO of the enhanced workflow, which can be controlled via a graphical user interface or through the command-line for batch processing.
File Information
The software can be downloaded at: SINOMO.zip
The following files are supplied:
| readme.pdf | this file |
| sinomo.* | main files of GUI-version |
| workflow.m | main file of command-line version |
| !* | directories containing sub-functions for |
| workflow | |
| example_networks/*.csv | example networks in csv-file format |
System Requirements
Two versions of the code are supplied, which differ in their requirements: The first one requires Matlab (Mathworks Inc, Natick, USA) and allows the user to apply the workflow using a graphical user interface (GUI, Fig.![[*]](crossref.png) ).
The other one is a command-line utility that either requires Matlab or the free
alternative Octave (Eaton, 2002) and it can be easily used to batch process
many networks without user interaction.2When using Octave, the freely available packages econometrics and statistics must be installed.3
).
The other one is a command-line utility that either requires Matlab or the free
alternative Octave (Eaton, 2002) and it can be easily used to batch process
many networks without user interaction.2When using Octave, the freely available packages econometrics and statistics must be installed.3
Both the GUI- and command-line version make use of the gs-command (Ghostscript-package).4If this package is not installed, error messages appear, but the analysis is performed correctly. However, the output-plots are split into multiple pdf-files rather than a single one.
Please note that neither version of the code is intended to be fool-proof ant that absurd parameters are likely to yield absurd results. Only fundamental checks are performed; if desired, please implement sophisticated check-routines yourself.
Using SINOMO
The supplied code implements the improved Beyond the Average-workflow in two ways:- a script version (callable from the command-line) for both Matlab and Octave, and
- an interactive GUI version (running on Matlab only).
Command-line version
On Linux, the script version is run via the command
	matlab -nodisplay -nodesktop -nosplash \\
                      -r "workflow('$filename'); exit;"
if Matlab is installed; Octave can be evoked by
octave --eval "workflow('$filename'); exit;"
where the variable $filename has to be replaced by the filename of the
csv-file to analyse.
(Details on file formats are given in Section .)
The script outputs are pdf- and mat-files, which are named similar to the input
file.
GUI-version
To use the GUI version, start up Matlab and set the working directory to that containing the main-file sinomo.m. Calling the corresponding function sinomo() opens a file selection dialog, where the csv-file to analyse must be selected. (Clicking cancel at this point terminates Matlab.) Network statistics are calculated before the main screen with 5 plots appears (Fig.).
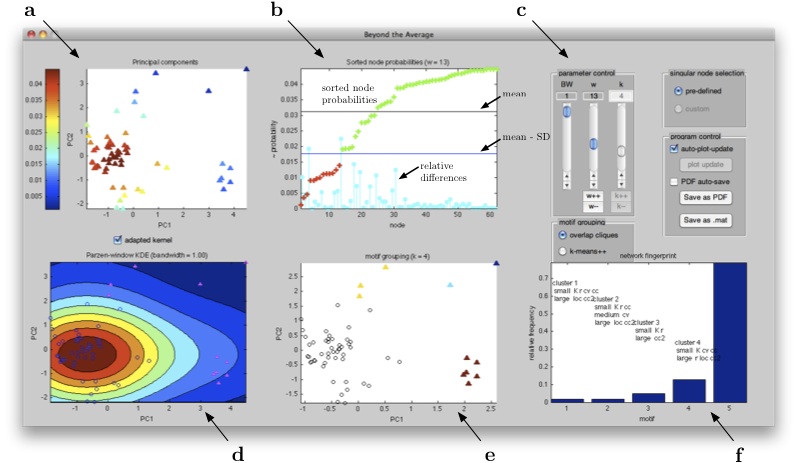
|
Use the sliders on the top right of the window to change parameters of the "Beyond the Average"-workflow. (Alternatively, values can be entered directly into the text fields or the corresponding +/- buttons.) Plots are updated on any parameter change, if auto-plot updates are enabled (default), and can be saved to a pdf-file. Note that only one instance of the SINOMO-GUI runs at a time; to exit the program close its window.
File Formats
Input
The only input-file to the workflow is a csv-file that contains the adjacency matrix
Output
For each input file <input>.csv, the workflow creates two output files named <input>_analysis.mat and <input>_bw_%4.2f_w_%i_k_%i.pdf. The mat-file stores all network-nodes' statistics, their mapping to the PCA-plane, estimated probabilities, the number of outliers.
All plots that are generated by the GUI-version are stored as a pdf-file; likewise for the command-line version. The output file-name informs about the input-file and all relevant parameters to replicate contained results.
Example Networks
To verify that SINOMO works on your system, we supply example networks as csv-files, which can be found in the folder example_networks. In detail, the smallest network ER_50.csv is an Erdos-Rényi random network with 50 nodes (Erdös and Rényi, 1959). Analysing the remaining networks mac95.csv, celegans131.csv, and celegans277.csv takes longer as these have 95, 131, and 277 nodes, respectively. These files represent neural connectivity of the Macaque cortex (one hemisphere) (Kötter, 2004; Kaiser and Hilgetag, 2006) and in C. elegans; consisting of 131 frontal neurons and all 277 neurons, respectively (Kaiser and Hilgetag, 2006; Choe et al., 2004). When applying SINOMO to any of these networks, expect processing times of up to 30 seconds; no error messages should appear in the console.
Program Customisation
Depending on your needs and computing environment, you might want to choose to adapt certain parts of the program. The following paragraphs make suggestions about changes we found to be particularly useful.
Manual Parameter Control
By default, both the command-line and the GUI-version of the workflow choose parameters automatically according to the mechanisms we described (Echtermeyer et al., 2011). Using the GUI, settings can be altered using the slider- and button-controls on the upper right. The command-line version also allows to choose some or all parameters manually by assigning values to the corresponding variables bandwidths, ws, and ks at the beginning of the file workflow.m. If multiple values are assigned (i.e. a vector) all of its values are used successively in any combination with the remaining parameters. The default setting of a parameter is chosen, if the parameter list is defined empty.
Improved Output Plots
By default, plots saved as a pdf-file appear side-centred with a significant margin, which can be reduced if the pdfcrop utility is installed.5To enable its use, edit the file save_plot.m in the !dataHandling directory and comment out the corresponding line in the save_and_crop-function that evokes the command.
High-Throughput Analyses
The command-line version of the supplied code is suitable for large scale data-analysis. It is mostly written such that Matlab/Octave makes use of small scale parallelisation on multi-core CPUs, which benefits run-time. Computer-clusters or similar architectures can give additional speed-up, which can be achieved in two ways:- When analysing many networks, total run-time is reduced by applying the workflow in parallel. This approach involves distributing data and programs, evoking calculations, and collecting results.
- For every single network, the computational bottleneck of the workflow is the calculation of local measures for all network nodes. In order to reduce the run-time of this step, different measure can be evaluated on different compute nodes, which makes analyses of very large networks feasible.
Final Remarks
Although implemented with care, software is seldomly free of bugs. We perform systematic testing after any change of the code, but errors may still remain. If you experience any problems, please let us know. Also, if you use this software for your research, please cite the corresponding paper (Echtermeyer et al., 2011) in any work you publish.
Details on <input>_analysis.mat
Following variables are stored in the file <input>_analysis.mat:
| no_of_nodes | number of (non-isolated) network nodes |
| w | number of singular nodes |
| k | number of motif groups |
| statistics | values of local measures (column) for each node |
| (row = feature-vector) | |
| stats_description | descriptive text-label for statistics-columns |
| PCA_projection | reduced feature-vectors (according to PCA) |
| probabilities | estimated probabilities |
| sorted_index | ranking of nodes according to probability |
| (node with lowest probability first) | |
| assignments | motif-group where singular node belongs to |
| noOfpointsInCluster | number of members in each motif group |
Bibliography
- R. Albert, H. Jeong, and A.-L. Barabási.
- Error and attack tolerance of complex networks.
Nature, 406: 378-82, 2000.
- Y. Choe, B. H. McCormcik, and W. Koh.
- Network connectivity analysis on the temporally augmented C. elegans
web: A pilot study.
In Society of Neuroscience Abstracts, page 30:921.9, Washington, DC, 2004. Society for Neuroscience.
- L. D. F. Costa, F. A. Rodrigues, C. C. Hilgetag, and M. Kaiser.
- Beyond the average: Detecting global singular nodes from local
features in complex networks.
Europhysics Letters, 87 (July): 18008, 2009.
- J. W. Eaton.
- GNU Octave Manual.
Limited, Network Theory, 2002.
- C. Echtermeyer, L. da Fontoura Costa, F. A. Rodrigues, and M. Kaiser.
- Automatic Network Fingerprinting through Single-Node Motifs.
PLoS ONE, 6: e15765, 2011.
- P. Erdös and A. Rényi.
- On Random Graphs I.
Publ. Math. (Debrecen), 6: 290-7, 1959.
- H. Jeong, S. P. Mason, A.-L. Barabási, and Z. N. Oltvai.
- Lethality and centrality in protein networks.
Nature, 411: 41-2, 2001.
- M. Kaiser and C. C. Hilgetag.
- Nonoptimal Component Placement, but Short Processing Paths, due to
Long-Distance Projections in Neural Systems.
PLoS computational biology, 2 (7): e95, 2006.
- R. Kötter.
- Online Retrieval, Processing, and Visualization of Primate
Connectivity Data From the CoCoMac Database.
Neuroinformatics, 2: 127-44, 2004.
- R. Milo, S. Shen-Orr, S. Itzkovitz, N. Kashtan, D. Chklovskii, and U. Alon.
- Network motifs: simple building blocks of complex networks.
Science, 298 (5594): 824-7, 2002.
- P. Ribeiro, J. Simonotto, M. Kaiser, and F. Silva.
- Parallel calculation of multi-electrode array correlation networks.
Journal of Neuroscience Methods, 184: 357-64, 2009.
- F. A. Rodrigues and L. D. F. Costa.
- Protein lethality investigated in terms of long range dynamical
interactions.
Molecular BioSystems, 5 (4): 385-90, 2009.
About this document ...
Automatic Network Fingerprinting Through Singular Node MotifsThis document was generated using the LaTeX2HTML translator Version 2008 (1.71)
Copyright © 1993, 1994, 1995, 1996,
Nikos Drakos,
Computer Based Learning Unit, University of Leeds.
Copyright © 1997, 1998, 1999,
Ross Moore,
Mathematics Department, Macquarie University, Sydney.
The command line arguments were:
latex2html -nonavigation -split 0 -local_icons -noaddress -no_footnode -no_reuse readme.tex
The translation was initiated by Christoph Echtermeyer on 2011-02-09
Footnotes
- ...mfinder.1
- http://www.weizmann.ac.il/mcb/UriAlon/
- ... interaction.2
- The code has been tested on Matlab version 7.9.0 [R2009b] and Octave version 3.2.3.
- ... installed.3
- http://octave.sourceforge.net/
- ...Ghostscript-package).4
- http://www.ghostscript.com/
- ... installed.5
- http://pdfcrop.sourceforge.net/
- ... tool.6
- http://www.dcc.fc.up.pt/adapa/